Case Study / 90-Day Google Ads Performance
$243K in tracked revenue on $65K of ad spend. 3,310 conversions, 3.73x ROAS, across a single 90-day window.
A multi-channel direct-to-consumer ecom brand on Google Ads. The headline numbers below are clean snapshots from the platform: cost, conversion value, conversion volume, and the period-over-period direction of each.
|
Spend
$65.1K
+$22.8K
|
Revenue
$243K
+$106K
|
Conversions
3,310
+1,260
|
ROAS
3.73x
+0.50
|
01 / The Snapshot
Three months. One account. The numbers that matter.
This is a direct-to-consumer ecommerce brand running Google Ads across Search, Shopping, and Performance Max. The window is 90 days. The headline figure is straightforward: $65,100 in ad spend produced $243,000 in tracked revenue, across 3,310 attributed conversions, at an average return of 3.73 times the spend.
What makes the period a case study, rather than a status report, is what happened underneath those totals. Spend went up. Volume went up. Efficiency went up. Three things that usually pull against each other moved in the same direction at the same time. That does not happen by accident.
02 / The Comparison
Spend scaled 54%. Efficiency went up, not down.
The standard scaling story in paid media goes like this: spend goes up, ROAS goes down, and the operator argues that the volume gain justifies the efficiency loss. That is not what happened here. Every metric in the comparison moved in the right direction, with the largest gains coming from the metrics that compound, conversion volume and ROAS.
|
|
||||||||||||||||||||
Reading the deltas
- Spend up 54%. A meaningful step-change, not a marginal increase.
- Revenue up 77%. Outpaced the spend increase by 23 points.
- Conversions up 61%. Volume scaled cleanly without softening the conversion rate.
- ROAS up 0.50. The metric that almost always drops when spend scales held its ground and improved.
03 / What Drove It
Three levers, applied in sequence.
Scaling without losing efficiency is rarely about a single tactic. It is about sequencing the work so that each lever sets up the next. Here is what that looked like across the 90-day window.
|
Lever 01
Channel mix correctionSearch, Shopping, and PMax were rebalanced based on incremental contribution, not platform-reported ROAS. Shopping and Search took on more share where they were producing genuinely new buyers. Effect: Cleaner attribution, less double-counting. |
Lever 02
Bid strategy disciplineTarget ROAS bidding was set against profitability thresholds, not vanity ROAS targets. Underperforming campaigns were paused or restructured rather than starved of budget incrementally. Effect: Spend flowed where it earned a return. |
Lever 03
Creative and feed healthProduct feed was cleaned and segmented. PMax asset groups were rebuilt by product category with dedicated creative and audience signals, rather than one catch-all asset group. Effect: The algorithm had something to optimise against. |
None of these levers is novel on its own. The discipline was in the order: fix attribution first so the data is trustworthy, then adjust bidding so the data is acted on correctly, then layer creative on top so the algorithm has the inputs it needs to scale.
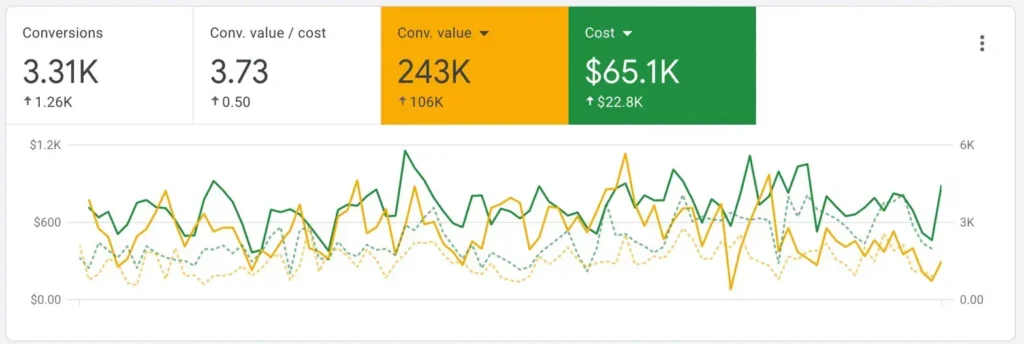
04 / What the Chart Shows
Daily revenue ran consistently above daily spend.
The 90-day chart is the truest read on whether the account was actually working, day by day. Two things stand out:
|
01
|
Revenue tracked above spend on a near-daily basis. The gap was not occasional, it was structural. That signals the account was earning, not gambling. |
|
02
|
Spikes in revenue came without proportional spikes in spend. The biggest revenue days were not the biggest spend days. That is the fingerprint of an account where the algorithm is allocating efficiently within set budgets. |
|
03
|
Volatility narrowed across the window. Conversion volume became more predictable as the algorithm collected cleaner signals, which is what makes scaling decisions possible in the first place. |
05 / The Takeaway
Scaling spend and improving ROAS in the same window is not about pushing harder. It is about fixing what the platform is reading first.
A 54% spend increase that delivers a 77% revenue increase and a 0.50-point ROAS gain is not the result of louder bidding. It is what happens when channel mix, bid strategy, and creative inputs are corrected in the right order, and the algorithm is given clean data to scale against.